1TUG | pdb_00001tug

Aspartate Transcarbamoylase Catalytic Chain Mutant E50A Complex with Phosphonoacetamide, Malonate, and Cytidine-5-Prime-Triphosphate (CTP)


Experimental Data Snapshot

  • Method: X-RAY DIFFRACTION
  • Resolution: 2.10 Å
  • R-Value Free: 
    0.272 (Depositor), 0.260 (DCC) 
  • R-Value Work: 
    0.230 (DCC) 
  • R-Value Observed: 
    0.220 (Depositor) 

Starting Model: other
View more details

wwPDB Validation   3D Report Full Report


Ligand Structure Quality Assessment 

Created with Raphaël 2.3.0Worse 01 BetterLigand structure goodness of fit to experimental dataBest fitted CTPClick on this verticalbar to view details

This is version 1.5 of the entry. See complete history


Literature

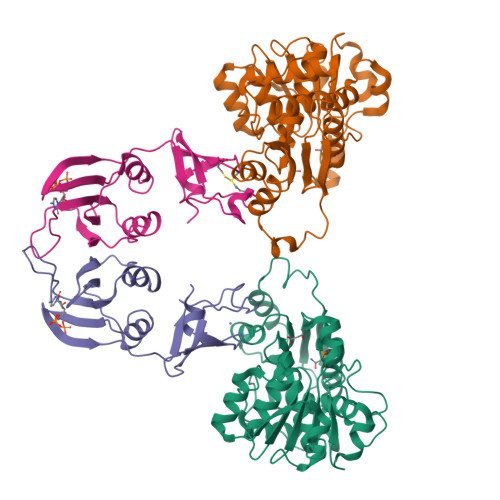
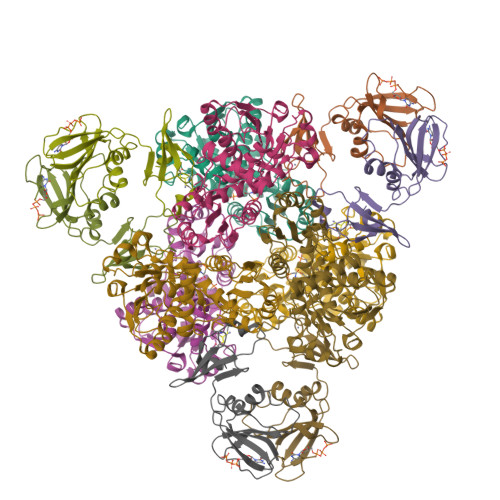
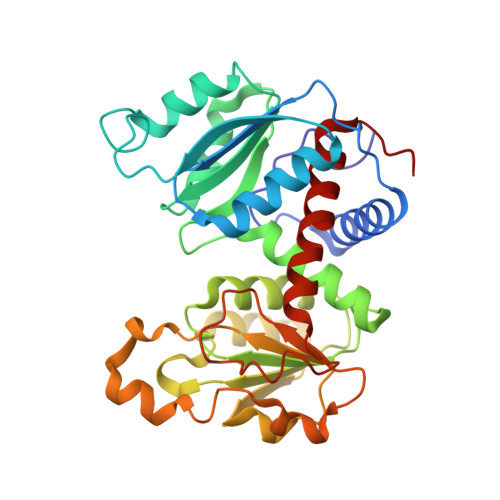
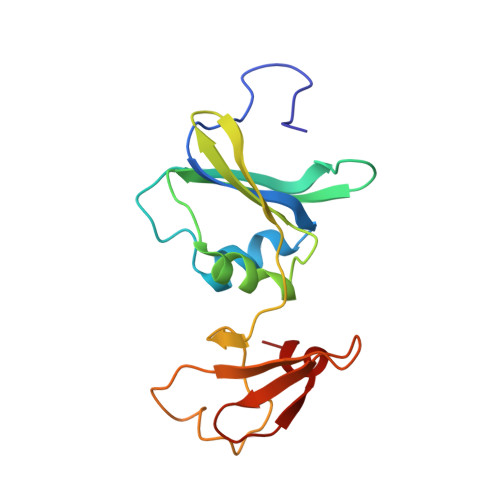
Monitoring the Transition from the T to the R State in E.coli Aspartate Transcarbamoylase by X-ray Crystallography: Crystal Structures of the E50A Mutant Enzyme in Four Distinct Allosteric States.

Stieglitz, K.Stec, B.Baker, D.P.Kantrowitz, E.R.

(2004) J Mol Biology 341: 853-868

  • DOI: https://doi.org/10.1016/j.jmb.2004.06.002
  • Primary Citation of Related Structures:  
    1TTH, 1TU0, 1TUG

  • PubMed Abstract: 

    A detailed description of the transition that allosteric enzymes undergo constitutes a major challenge in structural biology. We have succeeded in trapping four distinct allosteric states of a mutant enzyme of Escherichia coli aspartate transcarbomylase and determining their structures by X-ray crystallography. The mutant version of aspartate transcarbamoylase in which Glu50 in the catalytic chains was replaced by Ala destabilizes the native R state and shifts the equilibrium towards the T state. This behavior allowed the use of substrate analogs such as phosphonoacetamide and malonate to trap the enzyme in T-like and R-like structures that are distinct from the T-state structure of the wild-type enzyme (as represented by the structure of the enzyme with CTP bound and the R-state structure as represented by the structure with N-(phosphonacetyl)-L-aspartate bound). These structures shed light on the nature and the order of internal structural rearrangements during the transition from the T to the R state. They also suggest an explanation for diminished activity of the E50A enzyme and for the change in reaction mechanism from ordered to random for this mutant enzyme.


  • Organizational Affiliation

    Department of Chemistry, Merkert Chemistry Center, Boston College, Chestnut Hill, MA 02467, USA.


Macromolecules
Find similar proteins by:  (by identity cutoff)  |  3D Structure
Entity ID: 1
MoleculeChains Sequence LengthOrganismDetailsImage
Aspartate carbamoyltransferase catalytic chain
A, C
310Escherichia coliMutation(s): 1 
Gene Names: PYRBB4245C5345Z5856ECS5222SF4245S4507
EC: 2.1.3.2
UniProt
Find proteins for P0A786 (Escherichia coli (strain K12))
Explore P0A786 
Go to UniProtKB:  P0A786
Entity Groups  
Sequence Clusters30% Identity50% Identity70% Identity90% Identity95% Identity100% Identity
UniProt GroupP0A786
Sequence Annotations
Expand
  • Reference Sequence
Find similar proteins by:  (by identity cutoff)  |  3D Structure
Entity ID: 2
MoleculeChains Sequence LengthOrganismDetailsImage
Aspartate carbamoyltransferase regulatory chain
B, D
153Escherichia coliMutation(s): 0 
Gene Names: PYRIB4244C5344Z5855ECS5221
UniProt
Find proteins for P0A7F3 (Escherichia coli (strain K12))
Explore P0A7F3 
Go to UniProtKB:  P0A7F3
Entity Groups  
Sequence Clusters30% Identity50% Identity70% Identity90% Identity95% Identity100% Identity
UniProt GroupP0A7F3
Sequence Annotations
Expand
  • Reference Sequence
Small Molecules
Ligands 4 Unique
IDChains Name / Formula / InChI Key2D Diagram3D Interactions
CTP
Query on CTP

Download Ideal Coordinates CCD File 
H [auth B],
L [auth D]
CYTIDINE-5'-TRIPHOSPHATE
C9 H16 N3 O14 P3
PCDQPRRSZKQHHS-XVFCMESISA-N
PCT
Query on PCT

Download Ideal Coordinates CCD File 
F [auth A],
J [auth C]
PHOSPHONOACETAMIDE
C2 H6 N O4 P
AKVIWWJLBFWFLM-UHFFFAOYSA-N
MLI
Query on MLI

Download Ideal Coordinates CCD File 
E [auth A],
I [auth C]
MALONATE ION
C3 H2 O4
OFOBLEOULBTSOW-UHFFFAOYSA-L
ZN
Query on ZN

Download Ideal Coordinates CCD File 
G [auth B],
K [auth D]
ZINC ION
Zn
PTFCDOFLOPIGGS-UHFFFAOYSA-N
Experimental Data & Validation

Experimental Data

  • Method: X-RAY DIFFRACTION
  • Resolution: 2.10 Å
  • R-Value Free:  0.272 (Depositor), 0.260 (DCC) 
  • R-Value Work:  0.230 (DCC) 
  • R-Value Observed: 0.220 (Depositor) 
Space Group: P 3 2 1
Unit Cell:
Length ( Å )Angle ( ˚ )
a = 122.29α = 90
b = 122.29β = 90
c = 142.41γ = 120
Software Package:
Software NamePurpose
SHELXmodel building
SHELXL-97refinement
SDMSdata reduction
SDMSdata scaling
X-PLORphasing

Structure Validation

View Full Validation Report


Ligand Structure Quality Assessment 

Created with Raphaël 2.3.0Worse 01 BetterLigand structure goodness of fit to experimental dataBest fitted CTPClick on this verticalbar to view details

Entry History 

Deposition Data

Revision History  (Full details and data files)

  • Version 1.0: 2004-07-20
    Type: Initial release
  • Version 1.1: 2008-04-30
    Changes: Version format compliance
  • Version 1.2: 2011-07-13
    Changes: Version format compliance
  • Version 1.3: 2021-10-27
    Changes: Database references, Derived calculations
  • Version 1.4: 2024-04-03
    Changes: Data collection, Refinement description
  • Version 1.5: 2024-10-30
    Changes: Structure summary